Blog Archives
Usdaw Timetable for Cuts Affecting Working Family Budgets (Updated)
Here’s an updated version of the Usdaw timetable on cuts and their impact on family budgets, original version of which is here.
| Date | Cut / Change |
+ Gain £ |
– Loss £ |
Who’s Affected |
| January 2011 | VAT increased by 2.5% to 20% |
|
Average – 307 |
Average households pay £307 more
Average for those with children is £450 |
| Child Trust Fund abolished |
|
– 250 |
Babies born after 1/1/11 have no Child Trust Fund | |
| Education Maintenance Allowance abolished |
|
Up to – 1,170 |
Young people in England in Further Ed with household income less than £32400 | |
| April 2011 | Tax allowance increased by £1,000 (£700 over RPI x20%) |
0 to + 140 |
|
All basic rate taxpayers earning over £6,700 gain |
| NIC threshold & NIC rate increased |
0 to + 120 |
0 to – 200 |
Employees on less than £20,000 gain, higher earners lose out | |
| Child Tax Credit increased by £255 (£150 above 4.6% RPI) |
0 to +150 per child |
|
Families gain by no. of children x £150, tapered at 41% of income over threshold | |
| Working Tax Credit frozen, basic and 30 hour elements |
|
– 90 or – 125 |
Low wage earners working under 30 hr
Low wage earners working over 30 hrs |
|
| Increase Tax Credit claw-back (taper) by 2% to 41% |
|
Average – 160 |
Households lose up to 2% of tax credits
Usual loss = (Income less £6420) x 2% |
|
| Couples/lone parent element of WTC rose by CPI, not RPI |
|
– 25 |
All low-middle earning couples and lone parents claiming Working Tax Credit | |
| Baby element of Child Tax Credits abolished |
|
– 545 |
Families with new babies or babies under 1 in April 2011 | |
| Family element of Tax Credit abolished for higher earners |
|
– 545 |
Families with income between £41,000 and £58,000 | |
| Child Benefit frozen |
|
– 49 and – 32 |
For first child up to 16 or 19 if in FT Ed
Also – £32 for each other child |
|
| Childcare Tax Credit reduced from 80% to 70% |
|
Up to – 1,560 |
Families claiming CTC lose 10% of childcare cost. Average = £457 per child | |
| Sure Start Maternity Grant abolished for 2nd + babies |
|
– 500 |
Lower income families having 2nd or subsequent baby | |
| Health in Pregnancy Grant abolished |
|
– 190 |
Babies due after mid April 2011 | |
| Benefits to rise by CPI, not RPI |
|
– 50 |
Households lose out by around 1% of all benefits – around £50 | |
| October 2011 | Local Housing Allowance rates capped |
|
Average – 468 |
Capped at 30th percentile of local rents. 40% of claimants are in low-paid work. |
| April 2012 | Increase tax allowance by £630 (£250 over RPI x 20%) |
0 to +£190 |
|
All basic rate taxpayers earning over £7,850 gain |
| Child Tax Credit rises by CPI, but previous increase applies |
0 to +150 per child |
|
Families gain by no. of children x £150, tapered at 41% of income over threshold | |
| Family element of Tax Credit abolished for middle earners |
|
– 545 |
Lost if income is over £25,000 (1 child)/ £32500 (2 children)/£39000 (3 children) | |
| 50+ element of Tax Credits abolished |
|
-1,320 or – 1,965 |
People working 16 – 29 hours pw
People working over 30 hours pw |
|
| Couples’ Working Tax Credit based on 24 not 16 hrs pw |
|
Potential – 3,870 |
Couples with children unable to increase hours of work to 24 pw lose all WTC | |
| Working Tax Credit frozen
Basic & 30 hour elements |
|
– 205 or – 285 |
Low wage earners working under 30 hr
Low wage earners working over 30 hrs |
|
| Working Tax Credit frozen:
Couples/lone parent element |
|
– 135 |
All low-middle earning couples and lone parents claiming Working Tax Credit | |
| Child Benefit frozen |
|
– 112 and – 73 |
For first child up to 16 or 19 if in FT Ed
Also – £73 for each other child |
|
| Benefits & tax credits to rise by CPI, not RPI |
|
– 100 |
Households lose out by around 2% of all benefits – around £100 | |
| April 2013
|
Increase tax allowance by £1335 (£1125 over RPIx20%) |
0 to + 420 |
|
All basic rate taxpayers earning over £8,105 gain |
| Child Tax Credit capped at 1% – limits previous increase |
0 to +110 per child |
|
Families gain by no. of children x £110, tapered at 41% of income over threshold | |
| Child Benefit frozen |
|
– 143 and – 94 |
For first child up to 16 or 19 if in FT Ed
Also – £94 for each other child |
|
| Child Benefit abolished for higher rate taxpayers |
|
-1,055 & – 697 |
Households on over £50,000 lose up to £1055 for 1st child, & £697 for each other | |
| Working Tax Credit frozen:
Basic and 30 hour elements |
|
– 260 or – 365 |
People working under 30 hours
People working over 30 hours |
|
| Working Tax Credit: Couples/
Lone Parent part rises by 1% |
|
– 170 |
All couples and lone parents on Working Tax Credit lose out | |
| Bedroom Tax – 14% or 25% of Housing Benefit |
|
– 624 or – 1,144 |
540,000 households – 1 spare bedroom
120,000 households – 2 spare bedrooms |
|
| Council Tax Benefit cut
|
|
Up to – 250 Up to – 600 |
Up to 2.5m recipients not in employment
Almost 700,000 recipients in employment |
|
| DLA changed to Personal Independence Payments |
|
Average – 2,480 |
IA says 500,000 will cease to qualify for support, saving £1.24bn by 2015/16 | |
| Benefit Cap (in 4 Councils, nationwide from September) |
|
Average – 4,836 |
56,000 households will have their benefit reduced by an average £93 per week | |
| Benefits & tax credits to rise by CPI, not RPI |
|
Up to – 150 |
Households lose out by around 3% of all benefits – up to around £150 | |
| Localisation of the Social Fund |
|
Loss of Safety Net | Community Care Grants & Crisis Loans abolished. No ring-fenced funding devolved to Councils. | |
| October 2013 | Universal Credit: marginal deduction rate rises to 76% |
Average + 2,016 |
Average
– 1,644 |
3.1m will gain on average £168pm
2.8m will lose an average £137pm |
| April 2014 | Child Tax Credit capped at 1% (reduces the 2011 rise) |
0 to + 65 per child |
|
Families gain by no. of children x £65, tapered at 41% of income over threshold |
| Working Tax Credit increases capped at 1% (after freeze) |
|
– 295 – 415 |
People working under 30 hours
People working over 30 hours |
|
| Working Tax Credit: Couples/
Lone Parent part rises by 1% |
|
– 205 |
All couples and lone parents on Working Tax Credit lose out | |
| Child Benefit increases capped at 1% (after freeze) |
|
– 162 and – 107 |
£162 less for the first child
£107 less for each subsequent child |
|
| April 2015 | Child Tax Credit capped at 1% (reduces the 2011 rise) |
0 to + 5 per child |
|
Families gain by no. of children x £5, tapered at 41% of income over threshold |
| Working Tax Credit increases capped at 1% (after freeze) |
|
– 345 – 485 |
People working under 30 hours
People working over 30 hours |
|
| Working Tax Credit: Couples/
Lone Parent part rises by 1% |
|
– 255 |
All couples and lone parents on Working Tax Credit lose out | |
| Child Benefit increases capped at 1% (after freeze) |
|
– £189 and – £124 |
£189 less for the first child
£124 less for each subsequent child |
Census tables
This part of the 2011 Census website gives excel spreadsheets, broken down by region and by local authority, gives counts of a number of different kinds of demographic, social and economic data. I’ve linked directly to what I think are some of the most useful and instructive datasets to inform local political debates:
Demographics
Identity
Power Relations
- Adults not in employment and dependent children and persons with long-term health problem or disability for all households
- Lone parent households with dependent children
- Health and provision of unpaid care
- Tenure
- Rooms, bedrooms and central heating
- Car or van availability
- Communal establishment residents
- Qualifications and students
- Economic activity
- Hours worked
- Industry
- Occupation
- National Statistics Socio-Economic Classification
Migration
See all of the tables here: Release: 2011 Census, Key Statistics for Local Authorities in England and Wales
The Census website also summarises national findings broken down into the categories of ‘who we are,’ ‘how we live,’ and ‘what we do.’ It’s a good way of getting familiar with what the different categories refer to. Read 2011 Census: Key Statistics for England and Wales, March 2011
Professions affected by the 1% benefits uprating cap
There have been a few media mentions this week about a report by the Children’s Society showing how parents in different professions would be hit by the Government’s 1% cap on benefits. The report itself is a Parliamentary Briefing on the Second Reading of the Welfare Up-Rating Bill, here.
The really excellent bit is this table:
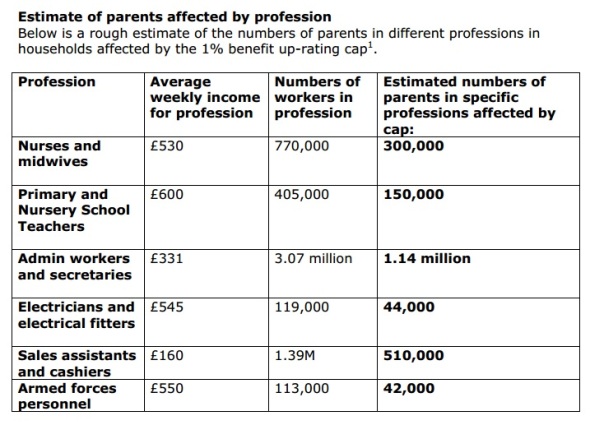
They also give these some very useful real life examples of how working parents in different professions will be affected by the Bill up to 2015:
- A lone parent working as a nurse with two children, earning £530 per week – would lose £424 a year by 2015.
- A couple with 3 children, one earner a second lieutenant in the Army, earning £470 per week – would lose £552 a year by 2015.
- A lone parent working as a hairdresser with one child, earning £195 per week – would lose £296 by a year 2015.
- A couple earning £395 per week with two children, one a childminder earning £240 per week, and the other a postal worker– would lose £351 a year by 2015.
Usdaw Timetable for Cuts to Working Family Budgets
Here’s a really useful table from USDAW timetabling the cuts which will impact on working family budgets from 2010-13. It’s a little out of date now, but still a useful guide.
| Date | Cut / Change | + Gain | – Loss | Who’s Affected |
| July 2010 | Child Trust Fund reduced & Top-ups at age 7 abolished | – £200- £250 | Babies born after 31/7/10 only get £50Children under 7 at 31/7/10 lose top-up | |
| January 2011 | VAT increased by 2.5% to 20% | Average- £307 | Average household will pay £307 moreAverage for those with children is £450 | |
| Child Trust Fund abolished | – £250 | Babies born after 1/1/11 have no Child Trust Fund | ||
| Education Maintenance Allowance abolished | Up to- £1,170 | Young people in England in Further Ed with household income less than £32400 | ||
| April 2011 | Tax allowance increased by £1,000 (£776 over RPI x20%) | 0 to+ £135 | All basic rate taxpayers earning over £6,700 gain | |
| NIC threshold & NIC rate increased | 0 to+ £120 | 0 to- £200 | Employees on less than £20,000 gain, higher earners lose out | |
| Child Tax Credit increased by £255 (£128 above 5% RPI) | 0 to £128 per child | Families gain by no. of children x £128, tapered at 41% of income over £6,420 | ||
| Working Tax Credit frozen | – £96 or- £135 | Low wage earners working under 30 hrLow wage earners working over 30 hrs | ||
| Increase Tax Credit claw-back (taper) by 2% to 41% | Average- £160 | Households lose up to 2% of tax creditsUsual loss = (Income less £6420) x 2% | ||
| Baby element of Child Tax Credits abolished | – £545 | Families with new babies or babies under 1 in April 2011 | ||
| Family element of Tax Credit abolished for higher earners | – £545 | Families with income between £41,000 and £58,000 | ||
| Child Benefit frozen | – £50 and- £35 | For first child up to 16 or 19 if in FT EdAlso -£35 for each other child | ||
| Childcare Tax Credit reduced from 80% to 70% | Up to- £1560 | Families claiming CTC lose 10% of childcare cost. Average= £457 per child | ||
| Sure Start Maternity Grant abolished for 2nd + babies | – £500 | Lower income families having 2nd or subsequent baby | ||
| Health in Pregnancy Grant abolished | – £190 | Babies due after mid April 2011 | ||
| Benefits & tax credits to rise by CPI, not RPI | Up to- £100 | Households lose out by around 2% of all benefits – up to around £100 | ||
| October 2011 | Local Housing Allowance rates capped | Average- £ 468 | Capped at 30th percentile of local rents. 40% of claimants are in low-paid work. | |
| April 2012 | Increase tax allowance by £630 (£256 over RPI x 20%) | 0 to+ £186 | All basic rate taxpayers earning over £7,850 gain | |
| Family element of Tax Credit abolished for middle earners | – £545 | Lost if income is over £25,000 (1 child)/ £32500 (2 children)/£39000 (3 children) | ||
| 50+ element of Tax Credits abolished | -£1320 or- £1965 | People working 16 – 29 hours pwPeople working over 30 hours pw | ||
| Couples’ Working Tax Credit based on 24 not 16 hrs pw | Potential- £3,870 | Couples with children unable to increase hours of work to 24 pw lose all WTC | ||
| Working Tax Credit frozenBasic & 30 hour elements | – £197 or- £278 | Low wage earners working under 30 hrLow wage earners working over 30 hrs | ||
| Working Tax Credit frozenCouples/lone parent element | – £101 | All low-middle wage earners claiming Working Tax Credit | ||
| Child Benefit frozen | – £100 &- £ 70 | For first child up to 16 or 19 if in FT EdAlso -£70 for each other child | ||
| Benefits & tax credits to rise by CPI, not RPI | Up to- £200 | Households lose out by around 4% of all benefits – up to around £200 | ||
| April 2013 | Child Benefit frozen | – £150 &- £105 | For first child up to 16 or 19 if in FT EdAlso -£105 for each other child | |
| Child Benefit abolished for higher rate taxpayers | -£1,055 &- £ 697 | Households on over £42,500 lose £1055 for 1st child, also £697 for each other | ||
| Working Tax Credit frozen | – £303 or- £428 | People working under 30 hoursPeople working over 30 hours | ||
| Benefits & tax credits to rise by CPI, not RPI | Up to- £300 | Households lose out by around 6% of all benefits – up to around £300 | ||
| Start to transfer those on Tax Credits to Universal Credit | ? | ? | Rates unknown as yet but taper increases to 44% (76% for taxpayers) |
In-work housing benefit numbers
Here’s a report by the Building and Social Housing Federation on the growth of in-work recipients of housing benefit. It shows, among other things, that 92.8% of the increase in HB claimants last year were from claimants that were in work (p12).
The Growth of In-Work Housing Benefit Claimants: Evidence and policy implications
And here’s a graph showing variations in housing benefit claimant numbers since 1991 (p4):

There’s also a good summary of the findings at Inside Housing here. I’ve reproduced their ‘key findings’ bit below:
Key findings
4.95 million
number of housing benefit claimants in Great Britain, excluding Northern Ireland
300,000
extra claimants since January 2010, of which 279,000 were employed
93 per cent
proportion of the increase in housing benefit claims from in-work households
- In 2010 and 2011 sizeable numbers of in-work households started to claim housing benefit
- There has been a considerable change in the financial situation of households, this could be due to rent freezes, more part-time workers and inflation
- The Department for Work and Pensions will not achieve planned £2.25 billion savings on housing benefit if the number of in-work claimants continues to increase
Incapacity for Work Benefit Claimant Numbers 1972-2010
The report Trends in the Employment of Disabled People in Britain from the University of Essex has a graph showing numbers of people of people claiming incapacity or equivalent benefit from 1972 -2010. This is really useful as it allows us to compare what happened with incapacity numbers over periods of both Tory and Labour Government.
On page 4 the report says:
The graph shows a steady rise in the number of men and women receiving benefit on grounds of incapacity for work, from just under 600,000 in 1975 to just under 2.5 million in 1995 – a fourfold increase, equivalent to 7 per cent growth each year (compound).
After 1995, though, the rise in the number of claims in payment has either reduced or stopped, depending on which of the two series is being considered.”

This helps fill in the gap highlighted in my previous post about easily accessible government stats on IB only going back to 1999.
Incapacity Benefit numbers since 1999
Quarterly statistical summaries from DWP show how many people claim Incapacity Benefit and its successor, ESA, since 1999. IB itself was introduced in 1995- not sure why the stats don’t go back that bit further. I’m also looking for stats of Invalidity Benefit and Sickness Benefit prior to 1995, if anyone knows where these might be.
Here’s the latest quarterly DWP stats publication for November 2011 (pdf)
The stats for IB claimant numbers (and other types of benefit claimant) are on page 7, and are reproduced below.


Other useful welfare statistics links…
- List of national and official statistics produced by DWP
- DWP Statistics Archive (for discontinued publications)
- DWP Create Your Own Statistics*
*someone at DWP has a sense of humour
