Author Archives: Rich
Getting Petition Signatories
Here are some useful resources on how to get lots of people to sign a campaign petition:
Reading age and readability
The See a Voice website has some excellent guidance on how to judge how ‘readable’ your document is, as well as some helpful stats on average reading age in the UK.
They say:
The average reading age of the UK population is 9 years – that is, they have achieved the reading ability normally expected of a 9 year old.
The Guardian has a reading age of 14 and the Sun has a reading age of 8.
They’ve also got some excellent examples of how to make text more readable, both in terms of language and in terms of layout. Their layout advice is as follows:
- Use bold to take the reader to key words.
- Use meaningful subheadings (explain what’s in it for them).
- Bullet points to summarise content.
- Break up your copy into readable bite-sized chunks.
- One idea per paragraph.
They also produced an excellent downloadable guide on how to check a document’s readability, here: A guide to checking copy readability.
From both this guide and the Enable readability statistics guide from Word 2010, I’ve put together a quick guide of how to get usable reading statistics from a word document.
In a Word Document…
- Click the File tab, and then click Options.
- Click Proofing.
- Under When correcting spelling and grammar in Word, make sure the Check grammar with spelling check box is selected.
- Select Show readability statistics.
After you enable this feature, open a file that you want to check, and check the spelling. When Outlook or Word finishes checking the spelling and grammar, it displays information about the reading level of the document.
- The Flesch-Kincaid Grade Level figure is equivalent to a school year so, to get the reading age, add five (because children in Year One are usually aged five).
- Note that in older versions of Word, the scale only goes up to 12, the final year of secondary school.
- The formula for the Flesch-Kincaid Grade Level score is:
- (.39 x ASL) + (11.8 x ASW) – 15.59
- ASL = average sentence length (the number of words divided by the number of sentences)
- ASW = average number of syllables per word (the number of syllables divided by the number of words)
There’s also further useful reading on the difference between readability and reading ages by the Literacy Trust, here:
How many ‘illiterate’ adults are there in England?
Adult Skills Survey Results Released
Advice on how to write clearly and simply from the British Dyslexia Association
What Things Cost
Often in debates about public funds, there will be arguments along the lines of ‘why are you spending £10 million on x, when that could be used to pay for y which has a much greater marginal utility.’ However, as far as I’m aware there isn’t an easily accessible and exhaustive list of public pricings for different public policy choices- even budget papers require a lot of interrogation to get to allow you to get to useful comparison points.
That’s why the Guardian’s piece today on 23 things you could pay for with £10 million could be very useful. Even more useful is the spreadsheet at the end of the document, which gives the unit cost of a whole range of public and private goods, from teachers’ wages to house prices to energy bills to Prince Charles.
UN Office for the Coordination of Humanitarian Affairs: Palestine
The UN Office for the Coordination of Humanitarian Affairs (OCHA) provides some useful factual resources for people who want to learn more about the situation in Palestine.
Their factsheets give useful statistical information on the humanitarian impact of the occupation of the West Bank and the blockade of Gaza. Their maps plot out the increasing division of the West Bank (through settlements, checkpoints, roads, the wall and other de facto barriers) which are making a Palestinian state less and less viable. And their presentations give a useful summary of the key issues facing the Palestinian populations in Gaza, the West Bank and in East Jerusalem.
OCHA also produces a weekly monitor report on the impact of the occupation on civilians. They’re usually quite short and packed with useful information.
As a taster for those wanting to find out more about the Palestinian situation, I’d recommend the following:
East Jerusalem: Key Humanitarian Concerns
The humanitarian impact of Israeli Settlement Policy
Humanitarian Overview: The Gaza Strip
Here are a few fact sheet extracts to get you started:
- Around 293,000 Palestinians currently reside in East Jerusalem, in addition to 200,000 Israeli settlers who reside in the settlements which have been constructed and expanded since 1967, contrary to international law
- Palestinian residents of East Jerusalem lack a secure legal residency status. Between 1967 and mid-2010, around 14,000 Palestinians had their Jerusalem residency revoked by the Israeli authorities.
- At least 33% of all Palestinian homes in East Jerusalem lack Israeli-issued building permits, which are difficult to obtain, potentially placing at least 93,100 residents at risk of displacement. Since 1967, the Israeli authorities have demolished some 2,000 houses in East Jerusalem.
- Since 1967,Israel has established about 150 settlements (residential and others) in the West Bank, including East Jerusalem; in addition to some 100 “outposts” erected by settlers without official authorization.Three new settlements were approved in 2012 by retroactively ‘authorizing’ such outposts.
- Settlements are illegal under international law as they violate Article 49 of the Fourth Geneva Convention, which prohibits the transfer of the occupying power’s civilian population into occupied territory. This has been confirmed by the International Court of Justice, the High Contracting Parties to the Fourth Geneva Convention and the United Nations Security Council.
I’m always surprised by the wealth of information readily available about the human cost of the occupation and other military operations. I very much doubt anyone at OCHA wants to be in the position of cataloguing injustice rather than fighting it; but that requires other people to be aware of the information they are collecting, and that they act on it.
Usdaw Timetable for Cuts Affecting Working Family Budgets (Updated)
Here’s an updated version of the Usdaw timetable on cuts and their impact on family budgets, original version of which is here.
| Date | Cut / Change |
+ Gain £ |
– Loss £ |
Who’s Affected |
| January 2011 | VAT increased by 2.5% to 20% |
|
Average – 307 |
Average households pay £307 more
Average for those with children is £450 |
| Child Trust Fund abolished |
|
– 250 |
Babies born after 1/1/11 have no Child Trust Fund | |
| Education Maintenance Allowance abolished |
|
Up to – 1,170 |
Young people in England in Further Ed with household income less than £32400 | |
| April 2011 | Tax allowance increased by £1,000 (£700 over RPI x20%) |
0 to + 140 |
|
All basic rate taxpayers earning over £6,700 gain |
| NIC threshold & NIC rate increased |
0 to + 120 |
0 to – 200 |
Employees on less than £20,000 gain, higher earners lose out | |
| Child Tax Credit increased by £255 (£150 above 4.6% RPI) |
0 to +150 per child |
|
Families gain by no. of children x £150, tapered at 41% of income over threshold | |
| Working Tax Credit frozen, basic and 30 hour elements |
|
– 90 or – 125 |
Low wage earners working under 30 hr
Low wage earners working over 30 hrs |
|
| Increase Tax Credit claw-back (taper) by 2% to 41% |
|
Average – 160 |
Households lose up to 2% of tax credits
Usual loss = (Income less £6420) x 2% |
|
| Couples/lone parent element of WTC rose by CPI, not RPI |
|
– 25 |
All low-middle earning couples and lone parents claiming Working Tax Credit | |
| Baby element of Child Tax Credits abolished |
|
– 545 |
Families with new babies or babies under 1 in April 2011 | |
| Family element of Tax Credit abolished for higher earners |
|
– 545 |
Families with income between £41,000 and £58,000 | |
| Child Benefit frozen |
|
– 49 and – 32 |
For first child up to 16 or 19 if in FT Ed
Also – £32 for each other child |
|
| Childcare Tax Credit reduced from 80% to 70% |
|
Up to – 1,560 |
Families claiming CTC lose 10% of childcare cost. Average = £457 per child | |
| Sure Start Maternity Grant abolished for 2nd + babies |
|
– 500 |
Lower income families having 2nd or subsequent baby | |
| Health in Pregnancy Grant abolished |
|
– 190 |
Babies due after mid April 2011 | |
| Benefits to rise by CPI, not RPI |
|
– 50 |
Households lose out by around 1% of all benefits – around £50 | |
| October 2011 | Local Housing Allowance rates capped |
|
Average – 468 |
Capped at 30th percentile of local rents. 40% of claimants are in low-paid work. |
| April 2012 | Increase tax allowance by £630 (£250 over RPI x 20%) |
0 to +£190 |
|
All basic rate taxpayers earning over £7,850 gain |
| Child Tax Credit rises by CPI, but previous increase applies |
0 to +150 per child |
|
Families gain by no. of children x £150, tapered at 41% of income over threshold | |
| Family element of Tax Credit abolished for middle earners |
|
– 545 |
Lost if income is over £25,000 (1 child)/ £32500 (2 children)/£39000 (3 children) | |
| 50+ element of Tax Credits abolished |
|
-1,320 or – 1,965 |
People working 16 – 29 hours pw
People working over 30 hours pw |
|
| Couples’ Working Tax Credit based on 24 not 16 hrs pw |
|
Potential – 3,870 |
Couples with children unable to increase hours of work to 24 pw lose all WTC | |
| Working Tax Credit frozen
Basic & 30 hour elements |
|
– 205 or – 285 |
Low wage earners working under 30 hr
Low wage earners working over 30 hrs |
|
| Working Tax Credit frozen:
Couples/lone parent element |
|
– 135 |
All low-middle earning couples and lone parents claiming Working Tax Credit | |
| Child Benefit frozen |
|
– 112 and – 73 |
For first child up to 16 or 19 if in FT Ed
Also – £73 for each other child |
|
| Benefits & tax credits to rise by CPI, not RPI |
|
– 100 |
Households lose out by around 2% of all benefits – around £100 | |
| April 2013
|
Increase tax allowance by £1335 (£1125 over RPIx20%) |
0 to + 420 |
|
All basic rate taxpayers earning over £8,105 gain |
| Child Tax Credit capped at 1% – limits previous increase |
0 to +110 per child |
|
Families gain by no. of children x £110, tapered at 41% of income over threshold | |
| Child Benefit frozen |
|
– 143 and – 94 |
For first child up to 16 or 19 if in FT Ed
Also – £94 for each other child |
|
| Child Benefit abolished for higher rate taxpayers |
|
-1,055 & – 697 |
Households on over £50,000 lose up to £1055 for 1st child, & £697 for each other | |
| Working Tax Credit frozen:
Basic and 30 hour elements |
|
– 260 or – 365 |
People working under 30 hours
People working over 30 hours |
|
| Working Tax Credit: Couples/
Lone Parent part rises by 1% |
|
– 170 |
All couples and lone parents on Working Tax Credit lose out | |
| Bedroom Tax – 14% or 25% of Housing Benefit |
|
– 624 or – 1,144 |
540,000 households – 1 spare bedroom
120,000 households – 2 spare bedrooms |
|
| Council Tax Benefit cut
|
|
Up to – 250 Up to – 600 |
Up to 2.5m recipients not in employment
Almost 700,000 recipients in employment |
|
| DLA changed to Personal Independence Payments |
|
Average – 2,480 |
IA says 500,000 will cease to qualify for support, saving £1.24bn by 2015/16 | |
| Benefit Cap (in 4 Councils, nationwide from September) |
|
Average – 4,836 |
56,000 households will have their benefit reduced by an average £93 per week | |
| Benefits & tax credits to rise by CPI, not RPI |
|
Up to – 150 |
Households lose out by around 3% of all benefits – up to around £150 | |
| Localisation of the Social Fund |
|
Loss of Safety Net | Community Care Grants & Crisis Loans abolished. No ring-fenced funding devolved to Councils. | |
| October 2013 | Universal Credit: marginal deduction rate rises to 76% |
Average + 2,016 |
Average
– 1,644 |
3.1m will gain on average £168pm
2.8m will lose an average £137pm |
| April 2014 | Child Tax Credit capped at 1% (reduces the 2011 rise) |
0 to + 65 per child |
|
Families gain by no. of children x £65, tapered at 41% of income over threshold |
| Working Tax Credit increases capped at 1% (after freeze) |
|
– 295 – 415 |
People working under 30 hours
People working over 30 hours |
|
| Working Tax Credit: Couples/
Lone Parent part rises by 1% |
|
– 205 |
All couples and lone parents on Working Tax Credit lose out | |
| Child Benefit increases capped at 1% (after freeze) |
|
– 162 and – 107 |
£162 less for the first child
£107 less for each subsequent child |
|
| April 2015 | Child Tax Credit capped at 1% (reduces the 2011 rise) |
0 to + 5 per child |
|
Families gain by no. of children x £5, tapered at 41% of income over threshold |
| Working Tax Credit increases capped at 1% (after freeze) |
|
– 345 – 485 |
People working under 30 hours
People working over 30 hours |
|
| Working Tax Credit: Couples/
Lone Parent part rises by 1% |
|
– 255 |
All couples and lone parents on Working Tax Credit lose out | |
| Child Benefit increases capped at 1% (after freeze) |
|
– £189 and – £124 |
£189 less for the first child
£124 less for each subsequent child |
Parliament links
Links to various useful resources dotted around the Parliament website, for all those wanting to demystify the Parliamentary process:
- Parliament TV. Whatever is being broadcast from Parliament, including Select Committees and Public Bill Committees, will be here.
- Commons Hansard by date. Daily record of debates in the Commons and Westminster Hall, as well as written answers and corrections.
- Summary agenda and order of business. Shows the detailed order of business for the House on any given day. Very useful to compare to the actual hansard record in terms of seeing what questions were scheduled to be asked but weren’t due to lack of time.
- Future business. What’s happening in the Commons predominantly over the next week.
- Parliament Advanced Search feature. Allows you to search for key words and phrases amongst all Parliamentary publications, including PQs, debates and research briefings.
- Bills and legislation. Main gateway for Bills and draft Bills (example: Energy Bill page)
- Deposited papers. Statements from Ministers and Departments not made verbally in the chamber.
- Publications and records. All Parliamentary publications, including hansards of Lords debates and Public Bill committees.
- The Question Book. Shows all questions that have been tabled by MPs, but not yet answered.
- The Parliament Glossary. Includes explanations of lots of parliamentary jargon.
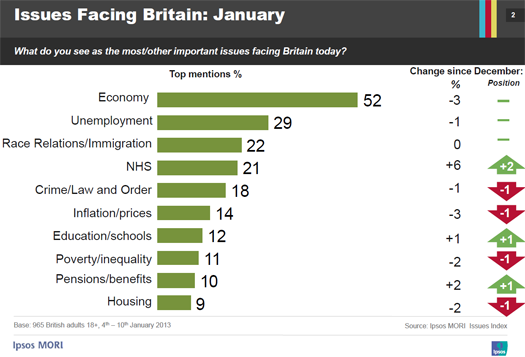
Polling Data
A raft of commentators and blogs will talk about opinion polls, but surprisingly few will link back to their source material. So a quick link to Ipsos MORI’s Research Archive is very helpful. Their issues index is particularly good, and the latest results can be seen here and at the bottom of the page.
In the interests of balance, here also is the Yougov polling archive, which I personally don’t find nearly as intuitive. In particular, look for their categories on Political Trackers and Politics.
Useful Ipsos MORI pages
- Research Archive
- Issues Index
- Voting Intention Trends
- Politicians and Parties (including current voting intentions)
Useful Yougov pages
Labour Party Rulebook
*Edited- the external site hosting the Labour Party rulebook appears to have taken it down. You can still access the up to date rules via the Labour membersnet rules and procedures section below.
Membersnet Rules and Procedures full web address: http://members.labour.org.uk/rules-and-procedures
Census tables
This part of the 2011 Census website gives excel spreadsheets, broken down by region and by local authority, gives counts of a number of different kinds of demographic, social and economic data. I’ve linked directly to what I think are some of the most useful and instructive datasets to inform local political debates:
Demographics
Identity
Power Relations
- Adults not in employment and dependent children and persons with long-term health problem or disability for all households
- Lone parent households with dependent children
- Health and provision of unpaid care
- Tenure
- Rooms, bedrooms and central heating
- Car or van availability
- Communal establishment residents
- Qualifications and students
- Economic activity
- Hours worked
- Industry
- Occupation
- National Statistics Socio-Economic Classification
Migration
See all of the tables here: Release: 2011 Census, Key Statistics for Local Authorities in England and Wales
The Census website also summarises national findings broken down into the categories of ‘who we are,’ ‘how we live,’ and ‘what we do.’ It’s a good way of getting familiar with what the different categories refer to. Read 2011 Census: Key Statistics for England and Wales, March 2011
Professions affected by the 1% benefits uprating cap
There have been a few media mentions this week about a report by the Children’s Society showing how parents in different professions would be hit by the Government’s 1% cap on benefits. The report itself is a Parliamentary Briefing on the Second Reading of the Welfare Up-Rating Bill, here.
The really excellent bit is this table:
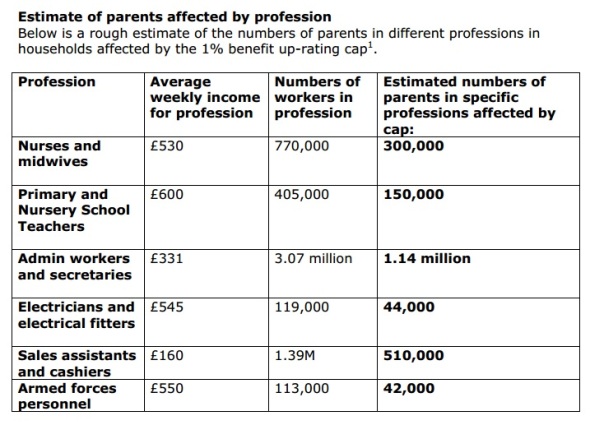
They also give these some very useful real life examples of how working parents in different professions will be affected by the Bill up to 2015:
- A lone parent working as a nurse with two children, earning £530 per week – would lose £424 a year by 2015.
- A couple with 3 children, one earner a second lieutenant in the Army, earning £470 per week – would lose £552 a year by 2015.
- A lone parent working as a hairdresser with one child, earning £195 per week – would lose £296 by a year 2015.
- A couple earning £395 per week with two children, one a childminder earning £240 per week, and the other a postal worker– would lose £351 a year by 2015.
