Monthly Archives: February 2012
Digest of UK Energy Statistics (DUKES)
The holy bible for statistics relating to energy policy is DUKES (the Digest of UK Energy Statistics). It has really in depth stats on UK energy production and use, broken down by energy type. It mostly covers the last 5 years, with some key indicators going back to 1970.
There is loads of interesting stuff here, but as with most government documents, the coolest stuff is near the end (in this case in a separate internet booklet).
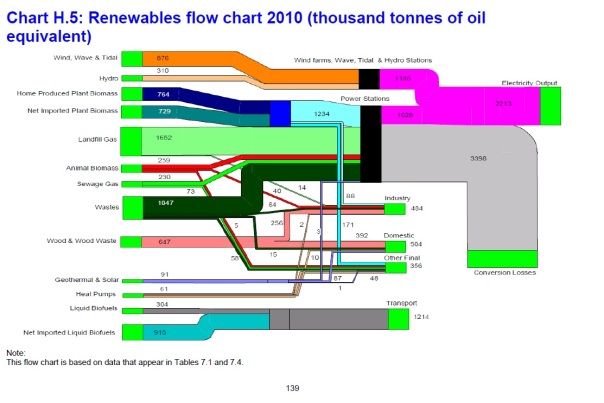
Here, for example, are some fascinating flow charts on where different types of energy goes in the UK (these are in Annex H starting p 135):
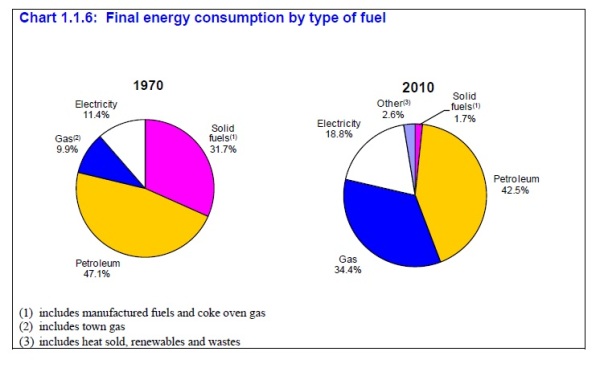
And here’s some graphs on energy consumption by user and by fuel (p165-166)
Local Fuel Poverty Statistics
This spreadsheet from DECC gives the estimated number of households living in fuel poverty by local authority, Parliamentary constituency and region.
The weakness in the figures is that they’re from 2009, which clearly predates a lot of recent energy price rises.
If I get time I might check on what’s happened overall to fuel poverty numbers since 2009, which would provide a crude mechanism for extrapolating an increase onto the local figures.
The spreadsheet shows in 2009 there were:
- 12,448 fuel poor households in Southampton (12.7% of households)
- The average (both median and mean) rate of fuel poverty by local authority was 18.2%- in Plymouth.
Fuel poverty rates by region are reproduced below:
| Fuel Poverty in English Regions | |||
| English region | Number of households1 | Number of households in fuel poverty1 | % of households fuel poor |
| East Midlands | 1,862,121 | 398,478 | 21.4% |
| East of England | 2,388,522 | 387,672 | 16.2% |
| London | 3,030,780 | 401,859 | 13.3% |
| North East | 1,127,904 | 271,519 | 24.1% |
| North West | 2,938,918 | 649,201 | 22.1% |
| South East | 3,481,988 | 410,928 | 11.8% |
| South West | 2,229,058 | 411,080 | 18.4% |
| West Midlands | 2,244,928 | 589,004 | 26.2% |
| Yorkshire and the Humber | 2,231,195 | 444,182 | 19.9% |
| TOTAL | 21,535,414 | 3,963,923 | 18.4% |
| 1 Note: Household and fuel poverty numbers at region level come from the national fuel poverty statistics, 2009 | |||
See the full spreadsheet: Fuel Poverty Sub Regional Statistics


